API Time series
Using RESTful services to get parcel time series
JRC RESTful service example requests have predefined logical query names that need to be configured with a set parameters. All requests return a response as a JSON formatted dictionary. The values in this dictionary are always lists, i.e. even if the query produced no (empty list) or only 1 value.
If the query is not valid, and empty dictionary will be returned ({}).
In this page, we keep a list of actual queries and provide some use examples.
Current queries
The server of JRC RESTful example currently runs from a CloudFerro server. The root URL of the RESTful server is http://185.178.85.226/query/ The URL requires authentication with a username and password (which has been provided to users upon request).
Query parameters are either required or optional. The order of parameters is not significant.
parcelByLocation
Find a parcel ID for a geographical location. The parcels in the annual declaration sets have unique IDs, but these are not consistent between years (also, the actual parcel geometries may have changed). Thus, a query is needed to “discover” which parcel ID is at a particular geographical coordinate. Agricultural parcels are supposed to be without overlap, a unique ID will normally be returned (this is, however, not a pre-condition).
Parameters |
Description |
Example call |
|---|---|---|
parcels |
parcel table name |
|
lon |
longitude in decimal degrees |
|
lat |
latitude in decimal degrees |
|
withGeometry=True |
adds geometry |
Currently, parameter values can be as follows:
Parameters |
Values |
Description |
|---|---|---|
parcels |
nld2018, nld2019, nrw2018, nrw2019 |
Netherlands, Nordrhein Westfalen, 2018 or 2019 |
lon, lat |
Any geographical coordinate inside the respective territories |
returns
Key |
Values |
Description |
|---|---|---|
ogc_fid |
a list of parcel ID |
Normally, only 1 ID should be returned. Empty list is no parcel found |
cropname |
a list of crop names |
Placeholder for the crop name, mapped to the original parcel table |
cropcode |
a list of crop code |
Placeholder for the crop code, mapped to the original parcel table |
srid |
a list of EPSG codes |
Describes the projection for the parcel geometry |
area |
a list of area |
The area, in square meters, of the parcel geometry |
clon |
a list of centroid longitude |
The longitude of the parcel centroid |
clat |
a list of centroid latitude |
The latitude of the parcel centroid |
geom |
a list of geometries |
WKT representations of the parcel geometry |
parcelTimeSeries
Get the time series for a parcel ID.
Parameters |
Description |
Example call |
|---|---|---|
aoi |
area of interest |
|
year |
year |
|
pid |
parcel ID |
|
tstype |
time series type |
|
band |
a selected band |
Currently, parameter values can be as follows:
Parameters |
Values |
Description |
|---|---|---|
aoi |
nld, nrw |
Netherlands, Nordrhein Westfalen |
year |
2018, 2019 |
|
tstype |
s2, bs, c6 |
Sentinel-2 Level 2A, S1 CARD Backscattering Coefficients, S1 CARD 6-day Coherence |
band |
B4, B8, SC |
if tstype=s2, Band 4 (RED, 10m), Band 8 (NIR, 10m), SC (Scene Classification, 20m) |
band |
VV, VH |
if tstype=bs or c6, VV, VH polarization (bs, 10m; c6, 20m) |
returns
Key |
Values |
Description |
|---|---|---|
date_part |
a list of timestamps |
as seconds since ‘Unix epoch’ (1970-01-01 00:00:00 UTC) |
band |
a list of image bands |
Missing if band query parameter is provided |
count |
a list of counts |
count of pixels extracted for each parcel and observation |
mean |
a list of means |
mean etc. |
std |
a list of stds |
standard deviation etc. |
min |
a list of mins |
min etc. |
max |
a list of maxs |
max etc. |
p25 |
a list of p25s |
25% histogram percentile etc. |
p50 |
a list of p50s |
50% histogram percentile etc. |
p75 |
a list of p75s |
75% histogram percentile etc. |
Simple python client to consume parcelTimeSeries response
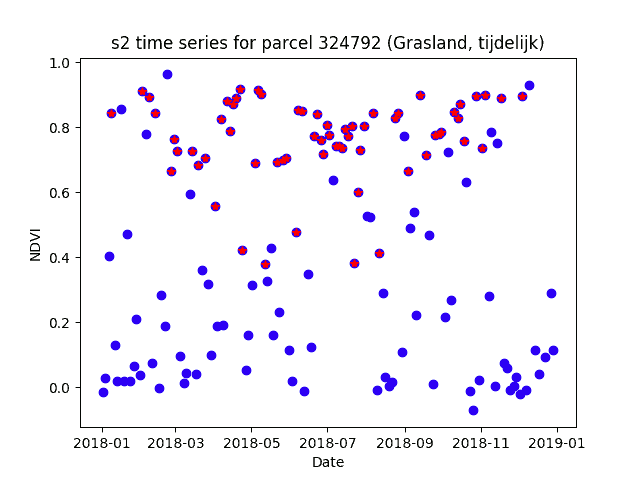
We show a complete example on how to use the RESTful queries in a python script. The script first requests the parcel details at the geographical location, and than retrieves the Sentinel-2 time series in a second request. The response of the latter query is parsed into a pandas DataFrame, which allows some data reorganisation and cleanup. The cleaned data is used to generate an NDVI profile which is then plotted, resulting in a figure as the one below. The blue dots are showing all NDVI values, those with a red inset are for observations that are cloud-free according to the “scene classifier” band of Sentinel 2 Level 2A.
import sys
import json

import requests
import pandas as pd
import matplotlib.pyplot as plt
from datetime import datetime

# Define your credentials here
username = 'YOUR USERNAME'
password = 'YOUR PASSWORD'

# Get the parcel id for this location
locurl = """http://185.178.85.226/query/parcelByLocation?parcels={}&lon={}&lat={}"""

# set the query parameters
parcels = 'nld2018'
lon='6.31'
lat='52.34'

# Parse the response with the standard json module
response = requests.get(locurl.format(parcels, lon, lat), auth = (username, password))

parcel = json.loads(response.content)

# Check response
if not parcel:
    print("Parcel query returned empty result")
    sys.exit()
elif not parcel.get(list(parcel.keys())[0]):
    print(f"No parcel found in {parcels} at location ({lon}, {lat})")
    sys.exit()

print(parcel)

# Use pid for next request
pid = parcel['ogc_fid'][0]
cropname = parcel['cropname'][0]

# Set up the timeseries request
tsurl = """http://185.178.85.226/query/parcelTimeSeries?aoi={}&year={}&pid={}&tstype={}"""

# query parameter values
aoi = 'nld'
year ='2018'
tstype = 's2'

response = requests.get(tsurl.format(aoi, year, pid, tstype), auth = (username, password))

# Directly create a pandas DataFrame from the json response
# This should work even if the response is and empty dictionary
df = pd.read_json(response.content)

# Check for an empty dataframe
if df.empty:
    print(f"Timeseries query returned empty result for parcel {pid} and {aoi}, {year} and {tstype}")
    sys.exit()

# Convert the epoch timestamp to a datetime
df['date_part']=df['date_part'].map(lambda e: datetime.fromtimestamp(e))

# Treat each band separately. Drop duplicate timestamps and rename the 'mean'
df4 = df[df['band']=='B4'][['date_part', 'mean']]
df4.drop_duplicates(['date_part'], inplace=True)
df4.rename(columns={'mean': 'B4'}, inplace=True)

df8 = df[df['band']=='B8'][['date_part', 'mean']]
df8.drop_duplicates(['date_part'], inplace=True)
df8.rename(columns={'mean': 'B8'}, inplace=True)

dfQA = df[df['band']=='SC'][['date_part', 'mean']]
dfQA.drop_duplicates(['date_part'], inplace=True)
dfQA.rename(columns={'mean': 'SC'}, inplace=True)

# Merge back into one DataFrame
dff = pd.merge(df4, df8, on = 'date_part')
dff = pd.merge(dff, dfQA, on = 'date_part')
# Create a NDVI
dff['ndvi'] = (dff['B8']-dff['B4'])/(dff['B8']+dff['B4'])

print(dff)

# Define the criteria for having a cloud free observation
cloudfree = ((dff['SC']>=4) & (dff['SC'] < 7))

plt.figure()
plt.plot(dff['date_part'], dff['ndvi'], linestyle = ' ', marker = 'o', color = 'blue')
plt.plot(dff[cloudfree]['date_part'], dff[cloudfree]['ndvi'], linestyle = ' ', marker = '*', color = 'red')
plt.title(f"{tstype} time series for parcel {pid} ({cropname})")
plt.xlabel('Date')
plt.ylabel('NDVI')
plt.show()
parcelPeers
Get the parcel “peers” for a known parcel ID, i.e. parcels with the same crop type as the reference within a certain distance. This can be useful for checking the relative behavior of a parcel against its nearest neighbors (with the use of parcelTimeSeries)
Currently, parameter values can be as follows:
Parameters |
Values |
Description |
|---|---|---|
aoi |
nld2018, nld2019, nrw2018 |
Netherlands, Nordrhein Westfalen |
pid |
int |
any valid parcel ID in parcels |
distance |
float |
in meters. Defaults to 1000.0. Truncated to 5000.0 if larger. |
max |
int |
Defaults to 10. Truncated to 100 if larger. |
returns
Key |
Values |
Description |
|---|---|---|
pid |
a list of parcel IDs |
|
distance |
a list of distances |
In ascending order |